Home / Administrator workspace
Steering with analytics
Volumes, processing times, AI accuracy and team performance — the steering dashboard, exportable to CSV.
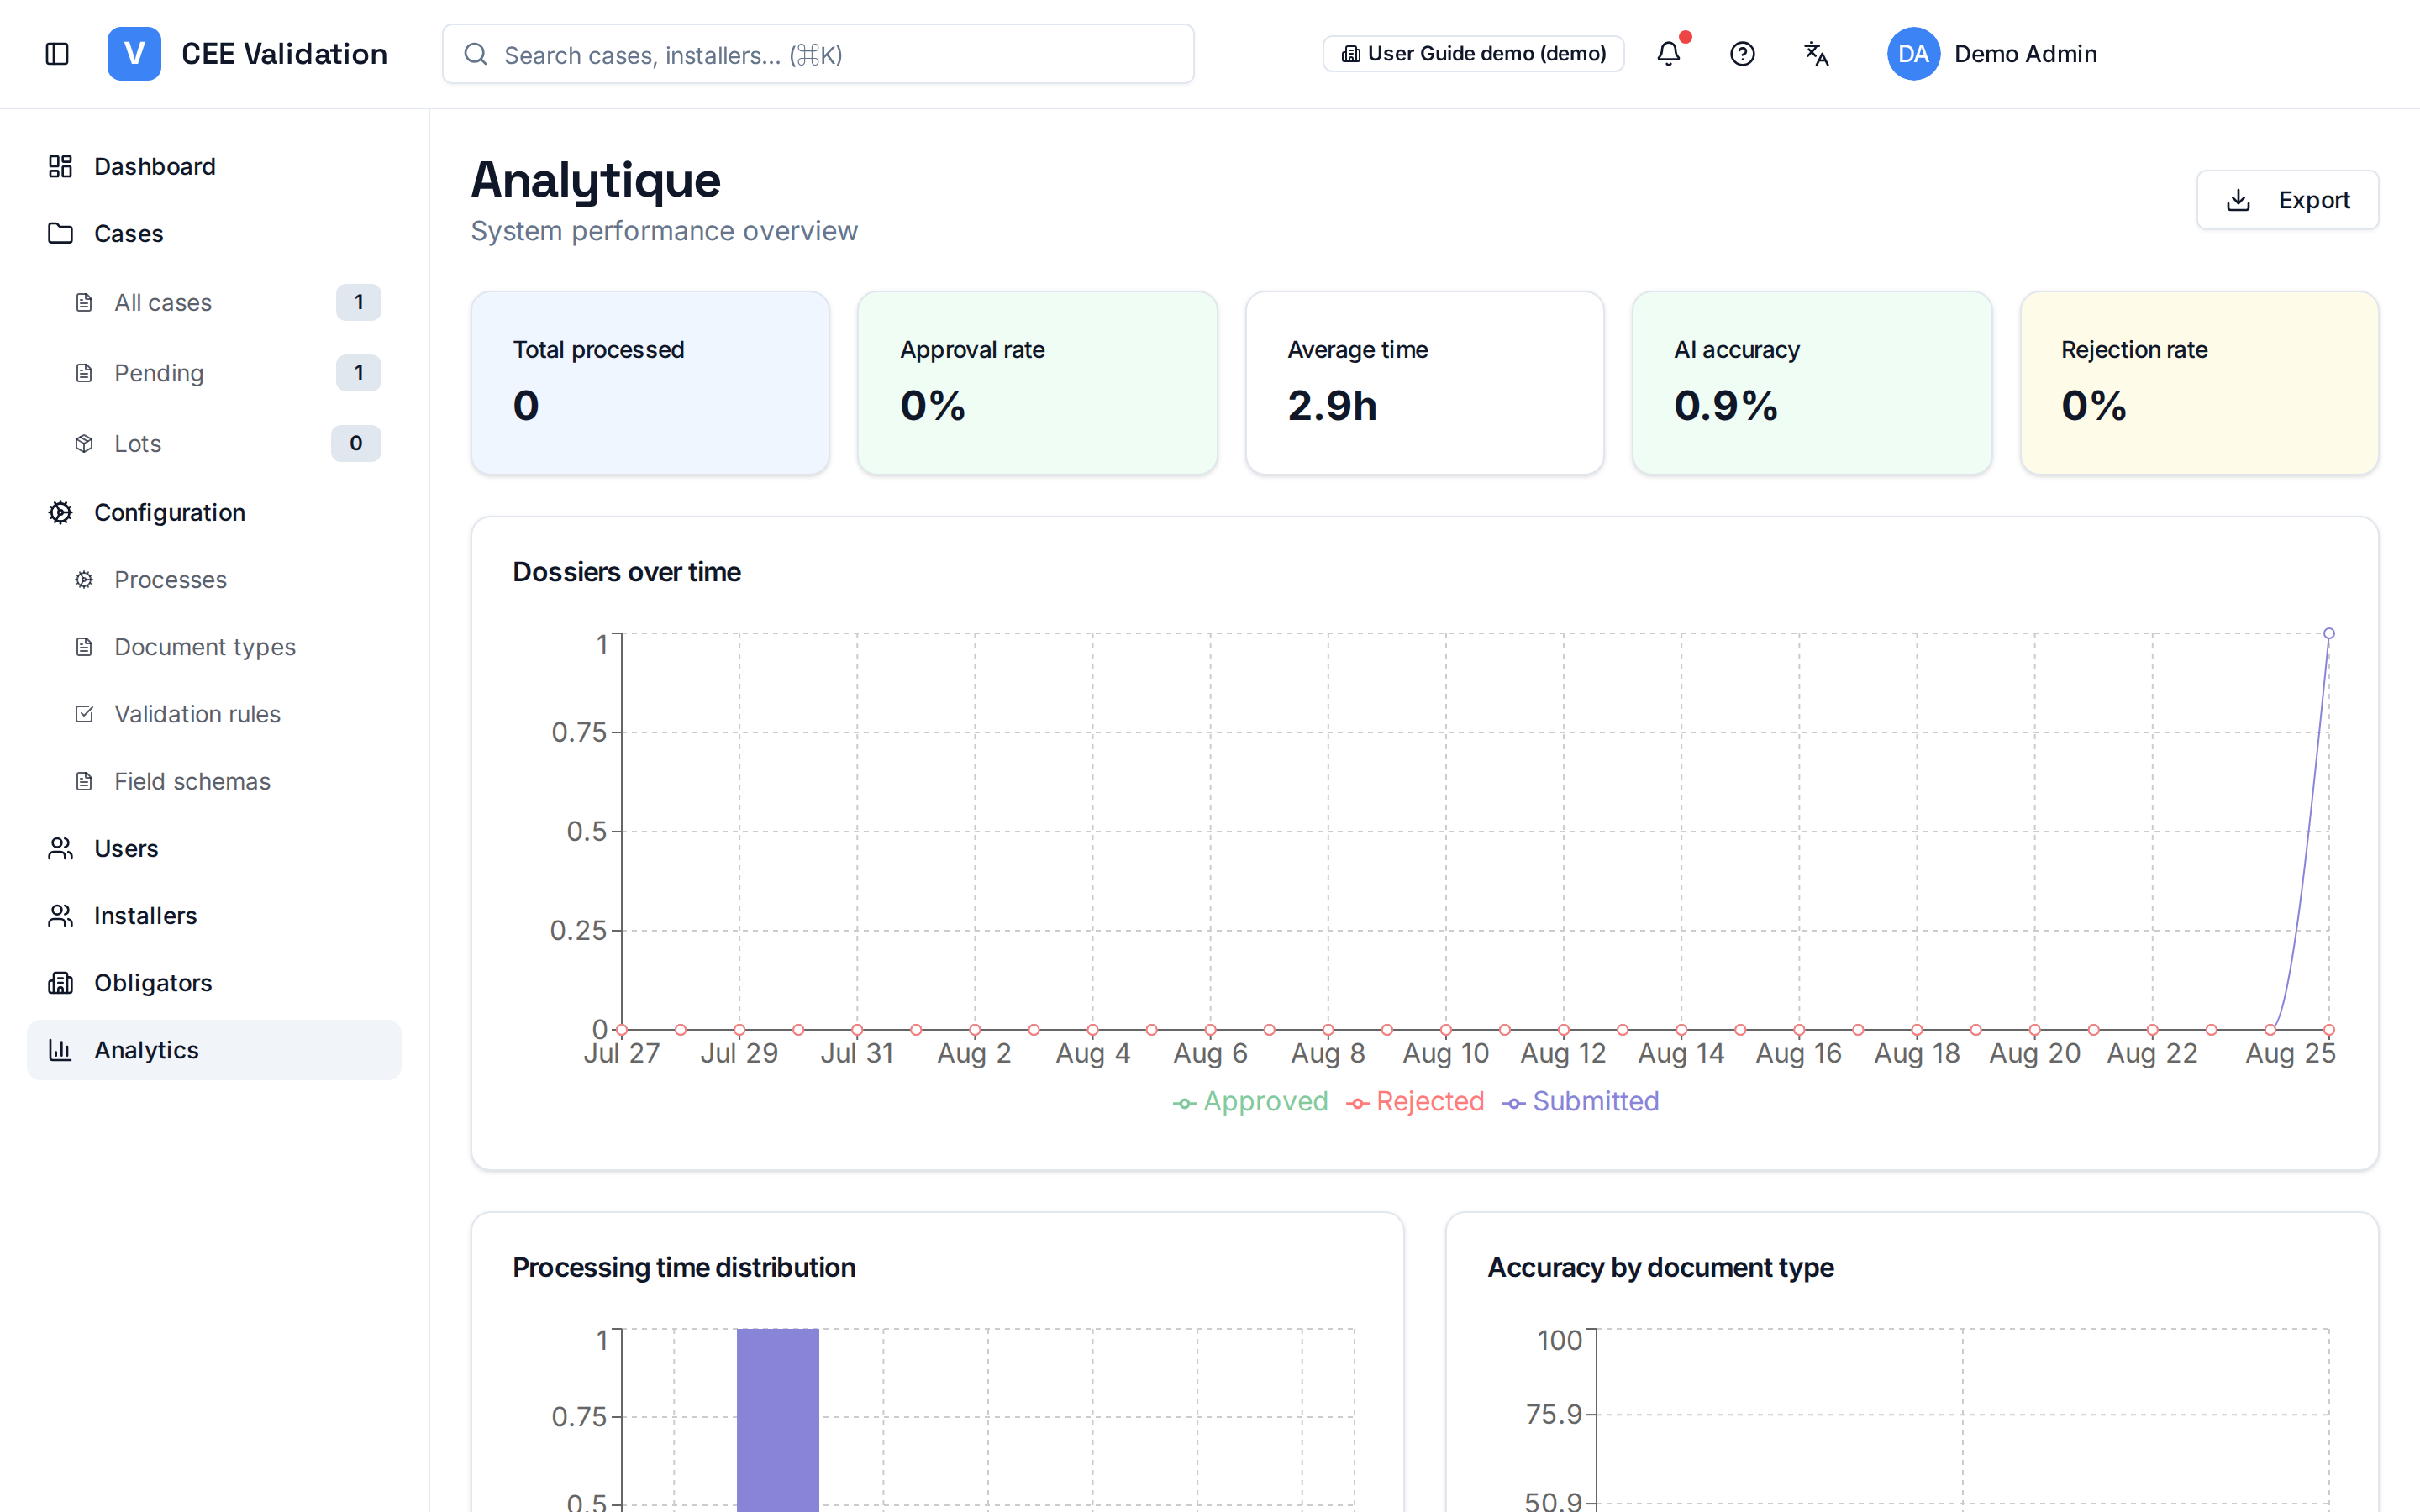
The Analytics page consolidates your organisation's activity: five key-indicator cards on top (volumes, rates, delays), then detailed visualisations — dossier trend over 30 days, processing-time distribution, AI accuracy per operation fiche.
Two performance tables complete the picture: per installer (who submits, with what dossier quality) and per validator (processed volumes, delays). They help identify installers needing support and balance validation workload.
All data is exportable to CSV for your own analysis or reporting — every table and chart offers its export.
Screenshots
Steps
- Open AnalyticsSidebar → “Analytics”. The five top KPIs give the immediate pulse.
- Read the trendsThe 30-day dossier curve shows submission dynamics; the time distribution reveals bottlenecks.
- Check AI accuracyThe per-fiche accuracy chart measures automatic extraction reliability, operation by operation.
- Analyse performanceInstaller and validator tables detail individual contributions — useful for support and workload balance.
- Export to CSVEach block offers its CSV export for integration into your reporting tools.